The Conflict Workbench
Conflict Tracking is the default workbench and the richest one. It's built for armed-conflict intelligence: mapping events, tracking the forces involved, watching for escalation, and fusing open-source reporting into a single weighted picture. If you signed in and changed nothing, this is where you are — the switcher pill reads ⚔️ Conflict Tracking in red.
This article is a map of the workbench; each capability links to its own article. Think of it as the index you return to when you're not sure where a task lives — the floor plan of the building, with signs pointing to each room.
What it tracks
- Events — discrete, located incidents: strikes, clashes, manoeuvres, and more.
- Actors — the factions and forces involved, with aliases, territory, and behaviour over time.
- Military units — specific elements on the ground, drawn with NATO-standard symbology.
- Areas of interest (AOIs) — analyst-defined regions to scope and alert on.
- Critical infrastructure — fixed assets that matter to the picture.
- Escalation signals — patterns and forecasts about where a situation is heading.
- Fused intel — the graded, clustered output of the intel pipeline.
Notice the layering here, because it mirrors how you'll actually think: intel is raw evidence, events are what the evidence establishes, actors and units are who's behind it, and escalation signals are what it all might mean next. Each tab below serves one of those layers.
The sidebar tabs
In Conflict the sidebar offers the full set, reachable from the left rail or the tab icons:
| Tab | What it's for |
|---|---|
| Events | Browse, filter, create, and inspect events — see Events |
| Feeds | Connect and manage live sources — see Feeds & Sources |
| Layers | Toggle imagery and data layers on the globe |
| Annotate | Draw markers, lines, areas, circles, and measurements |
| Actors | Track forces and their territory — see Actors & Territory |
| AOI | Define and monitor areas of interest |
| Stats | At-a-glance totals and trends (gateway to the Analytics Engine) |
| Intel | The fused intel feed |
| Browser | Find, group, and curate everything in the battlespace — see The Battlespace Browser |
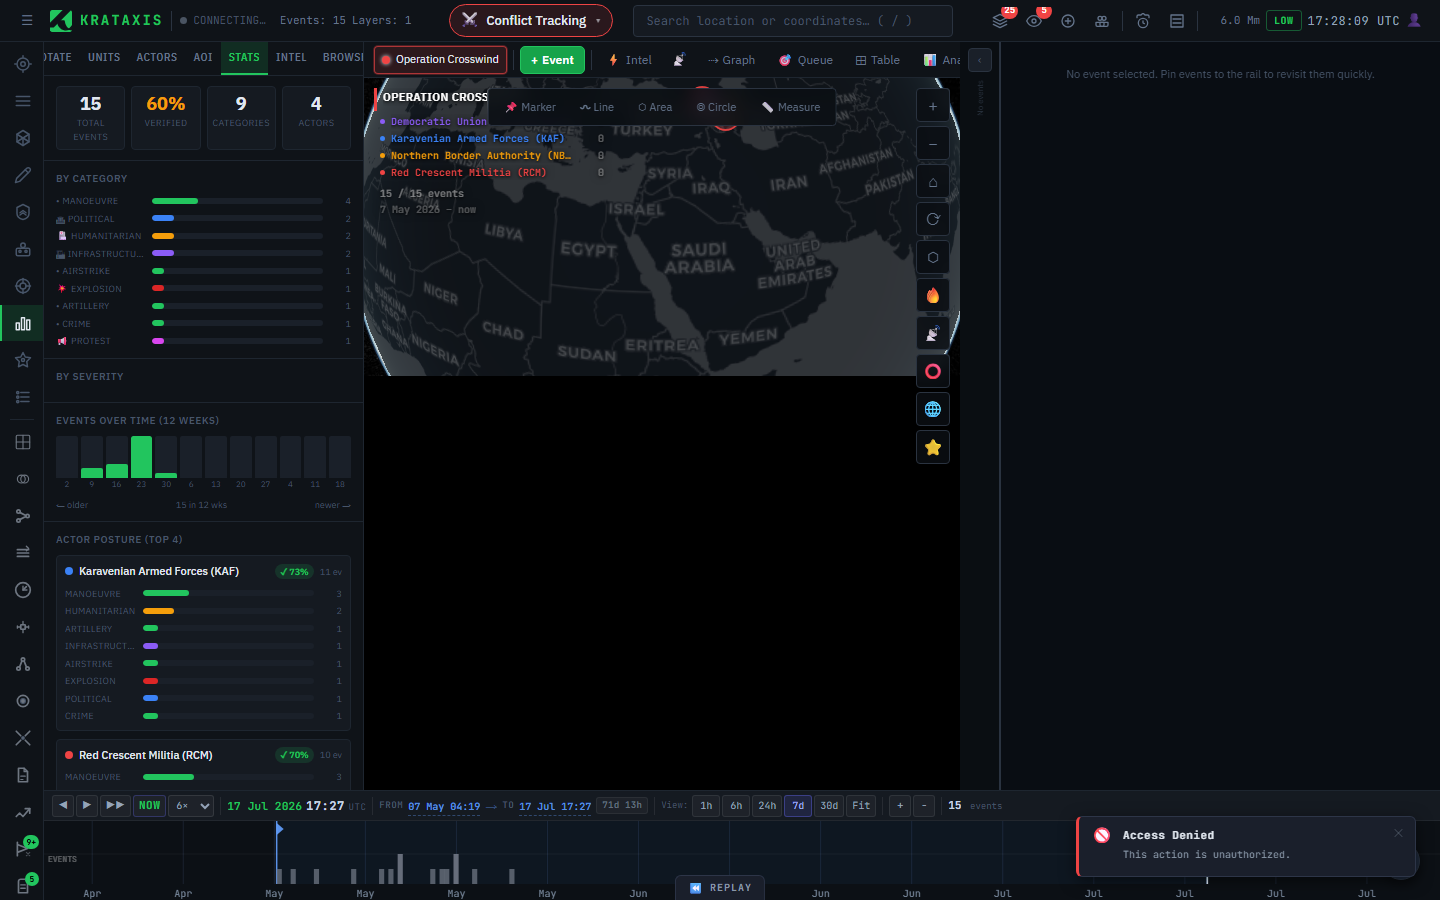
The Stats tab deserves a special mention as the fastest health-check on a battlespace: totals, verification rate, category and severity breakdowns, activity over time, and a posture profile per actor — all computed live from the focused battlespace.
Beyond the sidebar
The header and Tools menu add the heavier machinery: the Intel Fusion Engine (⚡ Intel), the Analyst Review Queue (🎯 Queue), the Intel Causal Graph (⇢ Graph), Predictions and Escalation Signatures, Deception Flags, Watchlist, and Intel Products. The header's alert badges (deception, watchlist, triage) keep time-sensitive items in view so nothing urgent slips past while you're heads-down.
A typical flow
A common way to work the Conflict workbench, start to finish:
- Focus a battlespace for the situation you're tracking (see Battlespaces).
- Connect feeds so live reporting flows in (see Feeds & Sources).
- Define the actors involved, so reporting gets attributed to a side (see Actors & Territory).
- Watch events and intel accumulate on the map, graded by credibility.
- Track territory as the actors' control and influence shift.
- Watch for escalation via predictions and signatures (see Escalation & Predictions).
- Trace cause and effect in the Intel Causal Graph.
- Triage near-confirmed items in the Analyst Review Queue, where your confirmation is final.
You won't do all of this every session — but that sequence is the shape of the work. Steps 1–3 are setup you do once per situation; steps 4–8 are the daily rhythm.
The same ideas elsewhere
Everything structural here — the container, the pipeline, credibility — carries to the other workbenches. The Health workbench swaps events-and-actors for cases-and-pathogens, and Disaster pares the set down to hazards and impact zones, but if you can work this workbench you can work the others. See Choosing a Workbench.
Where to next
- Events — the atomic incidents at the centre of the picture.
- Actors & Territory — the forces and the ground they hold.