A Tour of the Workstation
When you sign in, the platform root (/) loads the workstation: a full-screen 3D globe wrapped in the controls you use to read and shape the operational picture. This article names every region of that screen. The rest of the knowledge base refers to these names without re-explaining them each time.
Think of it as the layout of a physical operations room before your first shift: where the big screen is, where the phones are, which drawer holds the maps. Ten minutes here saves you an hour of searching later.
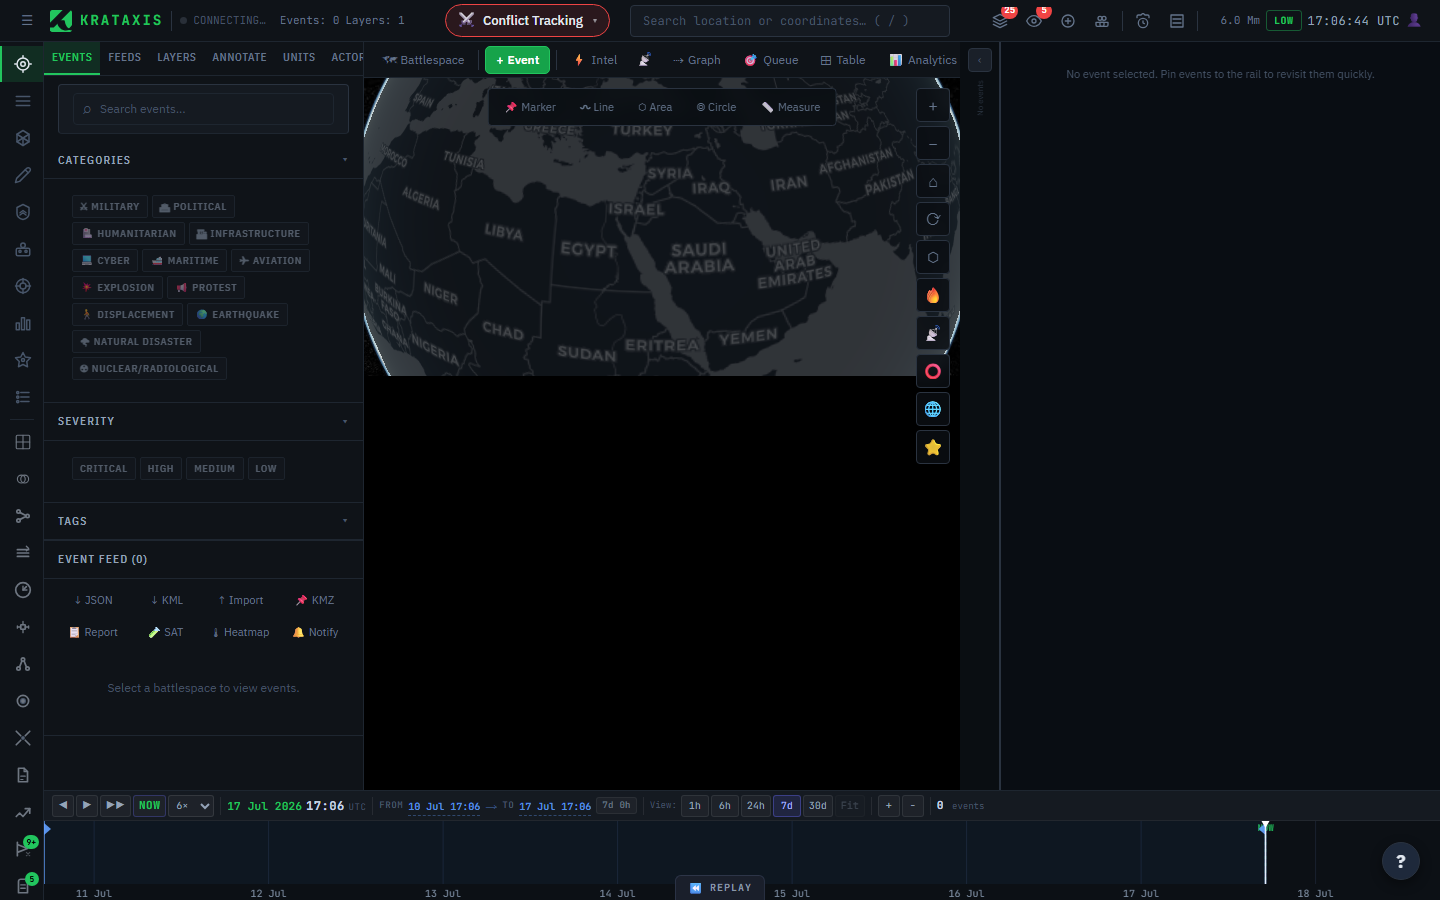
The layout is the same in every workbench. What changes is which tabs and panels appear. This tour describes the Conflict workbench (the default and the most complete). Health and Disaster use fewer tabs. See Choosing a Workbench for the differences.
How the regions relate. The globe is the canvas. The header holds global actions, search, and live status. The activity rail (left edge) and the sidebar beside it are how you open and read panels. The Tools menu is the full index of everything else. The command palette (Ctrl+K or Cmd+K) gives keyboard-first access to any command or entity. The help panel is always one click away. You will spend most of your time moving between the rail, the sidebar, and the globe.
The globe
The centre of the screen is a 3D globe. Events, intel, units, actors, and layers all render here as map features. You can pan, zoom, and tilt; the 2D / 3D toggle (in the Tools menu) flattens it to a planimetric map when you prefer. The current camera altitude is shown as a readout in the top bar.
The globe always reflects your current scope. With a battlespace focused, it shows only that situation; with none focused, it shows everything you have access to. If the map ever feels overwhelming, that's usually your cue to focus a battlespace — see Battlespaces.
The header (top bar)
A single strip across the top of the screen, read left to right. Each workbench tints the header with a subtle colour gradient so you can tell at a glance which domain you are in: red for Conflict, green for Health, amber for Disaster.
Left
- ☰ collapses and expands the sidebar.
- KRATAXIS logo.
- Live status: a dot that pulses green (LIVE) when the real-time feed is connected, or grey (CONNECTING...) while reconnecting. Beside it are running counts of Events and active Layers, a quick gauge of how much is on the map.
Centre
- Workbench switcher: the coloured pill (⚔️ Conflict Tracking by default). Click it to change operational domain.
- Search bar: type a place name, coordinates, or any keyword and press Enter. The search covers locations (via geocoding) and platform entities such as events, intel items, actors, units, battlespaces, and documents. Matching entities appear in a grouped dropdown below the input. Press / anywhere on the map to jump straight to this box. For airport lookups, type an ICAO or IATA code.
Right (the action cluster)
- + Event: create an event by hand.
- Battlespace context: your focused battlespace (or 🗺 Battlespace when none is focused). Click to open the battlespaces manager. In Health this becomes the Outbreaks button.
- ⚡ Intel: open the Intel Fusion Engine panel. 📡 toggles the live intel feed dock.
- ⇢ Graph: open the Intel Causal Graph. 🎯 Queue: open the Analyst Review Queue.
- Alert buttons: Deception Flags, Watchlist, and Triage each carry a badge with their unread count, so time-sensitive items stand out at a glance. Beside them sit the Collaboration feed and Replay (historical playback).
- ⊞ Tools: opens the Tools menu (described below).
- Status readouts: camera altitude, current threat level, and a live clock.
Far right
- 👤 user menu: your name, with links to My Profile, Preferences, and Sign out.
The activity rail (left edge)
A thin, always-visible icon column down the left side, grouped into three sections separated by rules:
- Sidebar tabs: one icon per sidebar pane. In Conflict that includes Events, Feeds, Layers, Annotate, Actors, AOI, Stats, Intel (Health adds Cases). Click one to open that pane in the sidebar.
- Overlay panels: one-click access to floating panels such as Battlespaces, Intel Fusion, Causal Graph, Triage, Analysis, SAT Workbench, Link Analysis, Analyst Queue, Coverage, Intel Products, and Escalation Signatures.
- Stage buttons: switch between the Globe, Analytics, and Investigations stages. The active stage button is highlighted with the accent colour.
- Utilities: pinned to the bottom.
The rail is the fastest way to move around. The same panels are also reachable from the header, the Tools menu, and the command palette. There is always more than one road to a panel, so you never need to remember the "right" one.
The sidebar
The pane beside the rail shows whichever tab you selected. Each tab has its own article, for example Events, Actors & Territory, and Feeds & Sources. Collapse the whole sidebar with ☰ when you want to give the map more room.
The Tools menu
Click ⊞ Tools to open a menu of icon tiles in three sections:
- Map & Layers: News ticker, Layers tree, Timeline, 2D / 3D toggle.
- Intelligence: Analysis, Predict, Escalate, Confidence Matrix, Intel Products, Links, SAT, Graph, Queue, Coverage, Escalation Signatures.
- Systems: Infrastructure, Webhooks, and (for permitted users) Admin.
Think of the Tools menu as the full index of secondary panels. Anything not pinned to the header or rail lives here. If you cannot find something, this is the first place to look.
The command palette
Press Ctrl+K (or Cmd+K on macOS) to open the command palette, a floating search box that gives keyboard-first access to two things:
- Commands: switch workbench, change stage, or toggle any panel. These filter instantly as you type. No additional loading is needed.
- Entity search: after three or more characters, the palette queries the platform for matching events, intel items, actors, units, battlespaces, documents, and more. Select a result to navigate to it.
A scope chip in the top-right corner of the palette lets you toggle between searching the whole platform and searching only the active battlespace.
The command palette and the header search bar query the same data. Use whichever suits your workflow: the palette for keyboard-driven access, the header bar for a persistent, always-visible input.
The timeline (bottom edge)
Along the bottom runs the timeline bar: a histogram of event activity over the visible window, with playback controls on the left and range presets (1h, 6h, 24h, 7d, 30d, Fit) on the right. Fit stretches the window to cover every event in your current scope — handy when you focus a battlespace whose activity happened weeks ago. The Replay button steps the clock backwards so you can watch a situation develop; see Replay & History.
The help panel
A floating ? button sits in the bottom-right corner of every screen. Click it to open the Knowledge Base slide-over. You can search the same articles you are reading now, browse by category, or jump to recently updated pages, all without leaving your work. Many panels pre-seed the search with a relevant query, so opening help often lands you on the right article straight away. Each article has an Open in new tab link to view it on the full /docs site.
Common first actions
| You want to... | Do this |
|---|---|
| Narrow to one situation | Open Battlespace context, focus a battlespace |
| Fly to a place | Press /, type a name or coordinates, press Enter |
| Find an event, actor, or intel item | Press Ctrl+K, type a keyword, select the result |
| See incoming intel | 📡 to open the live feed dock, or ⚡ Intel for the fusion panel |
| Add something you know happened | + Event |
| Find a panel you cannot see | Open ⊞ Tools (the full index) or press Ctrl+K and type the panel name |
Where to next
- Choosing a Workbench: what changes when you switch domains.
- Battlespaces: the container that organises everything you see on the map.