The Intel Causal Graph
The Intel Causal Graph is a full-page, node-link visualisation of a battlespace's events, intel items, and actors, connected by typed causal links. Where the map shows you where things happened, the graph shows you how they relate — the chains of cause and effect that turn a scatter of incidents into an explanation.
It's the tool you reach for when the question stops being "what happened?" and becomes "why, and what followed?" — the digital version of the detective's corkboard, with the string between the photographs drawn as typed, filterable links.
Opening it
Two ways in:
- ⇢ Graph in the header opens the graph inside the right-hand workspace dock, alongside the live map — useful when you want to keep spatial context.
- The full-page view at
/graphgives the graph the whole screen for dense investigations.
Reading the graph
A directed node-link diagram:
- Nodes are the entities — intel items, events, and actors — each drawn with a distinct shape so you can tell types apart at a glance.
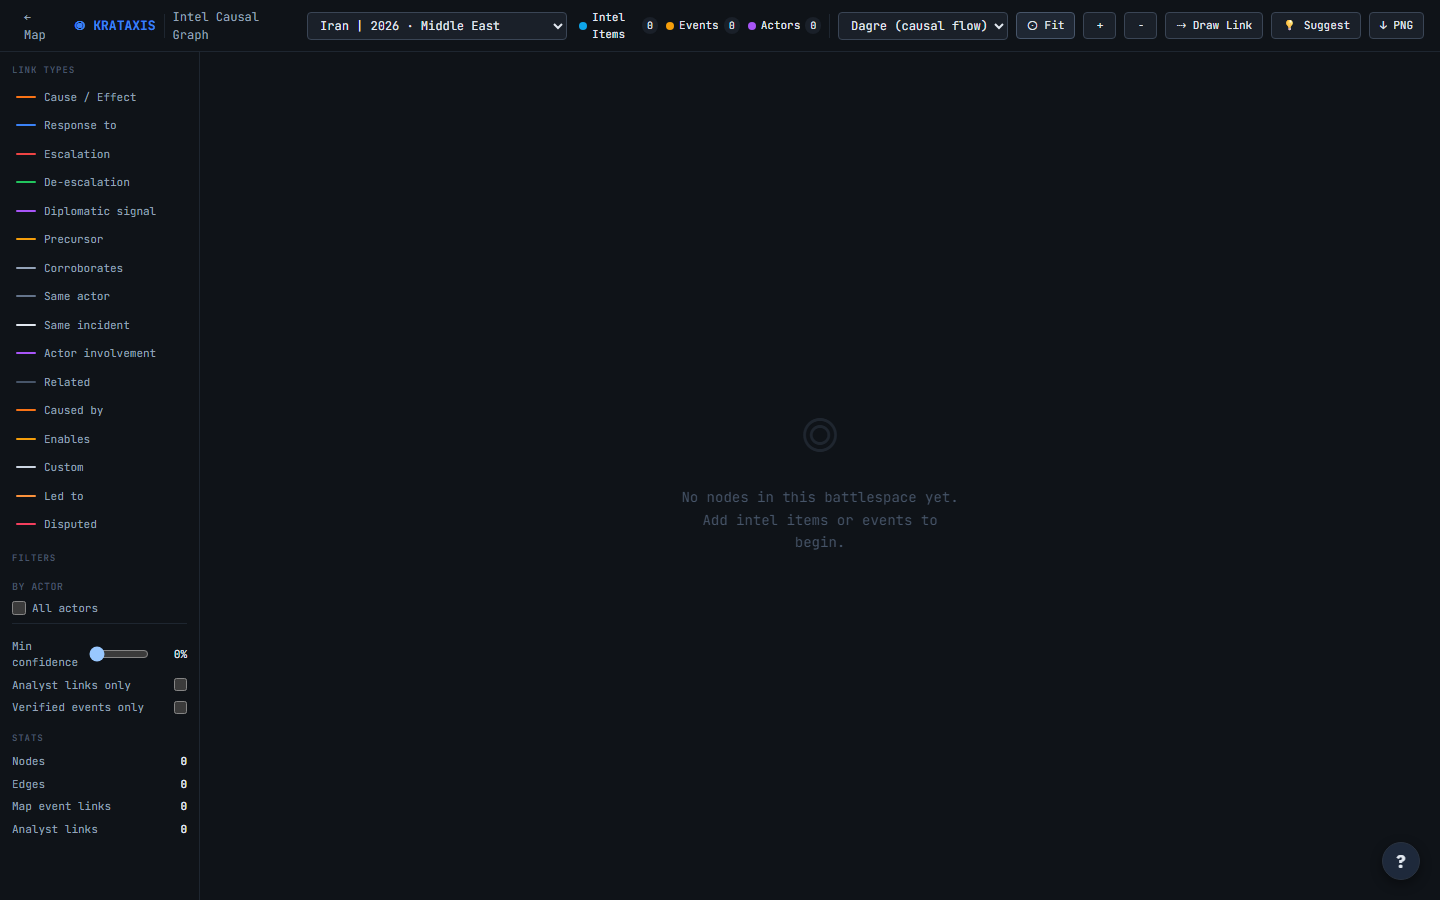
- Edges are typed causal links between them, colour-coded by type, with a legend down the left naming each — cause/effect, response to, escalation, corroborates, same incident, and more.
The link types matter because "related" is too vague to reason with. "A caused B" supports a very different conclusion from "A corroborates B" — the first builds a narrative, the second builds confidence. Typing the links keeps those two kinds of reasoning from blurring together.
Links come from two places, tracked separately in the stats: event links (the direct relationships you set between events — see Events) and causal-graph links (relationships modelled in the graph itself).
Controls
Across the top:
- A battlespace selector — the graph is scoped to one battlespace at a time.
- Node-type toggles with live counts — show or hide intel, event, or actor nodes to declutter.
- A layout dropdown — the causal-flow layout (Dagre) arranges nodes to flow along cause-and-effect direction; other layouts suit different shapes of investigation.
- A draw-link tool — click a source node, then a target, to draw a new causal link.
Down the left (legend & filters):
- The link-type legend, where each type can be toggled off to hide those edges.
- By Actor — filter to a specific actor's involvement.
- A minimum confidence slider — hide low-confidence links to focus on the strong chains.
- Live node and edge counts so you always know how much you're looking at.
Selecting a node
Click any node to open the detail panel with its full information. From there you can read into the entity and follow its connections outward — walking the chain link by link.
How to use it
The graph is at its best when you have a hypothesis to test:
- Scope it to the battlespace you're working.
- Filter to the actor or confidence level you care about.
- Switch to the causal-flow layout to see the direction of cause and effect.
- Trace the chain that leads to (or from) the event you're investigating.
Building event links as you work (see Events) is what makes those chains appear here — the graph is only as rich as the relationships you and the pipeline have established. An empty graph isn't broken; it's a battlespace whose story hasn't been linked together yet.
Where to next
- Events — where event links originate.
- Escalation & Predictions — the forward-looking complement to causal tracing.