Events — Creating, Inspecting & Linking
An event is a discrete, located incident — a strike, a clash, a manoeuvre — with a time and a place. Most events arrive automatically from the intel pipeline, built from one or more corroborating reports and graded for credibility. But you can also create events by hand when you know something the feeds haven't reported yet, or when you're recording your own assessment.
Events are the atoms of the conflict picture: actors act through events, territory shifts because of events, and the causal graph is built from events. Get comfortable with them and the rest follows.
Creating an event
Click + Event in the header to open the event form:
| Field | Notes |
|---|---|
| Title | A brief descriptive title |
| Category | The event category (defaults to Military) |
| Severity | Low → Critical (defaults to Medium) |
| Latitude / Longitude | Decimal degrees — e.g. 33.5138, 36.2765 |
| Description | The full narrative and intelligence notes |
| Source | Where it came from — a wire agency, a dataset, social media… |
| Source URL | A link to the original report |
| ESC code | The optional Event Symbology Code — e.g. ASASC |
| Tags | Free-form keywords |
Click Create Event. If you have a battlespace focused, the new event is automatically attached to it — no separate step.
Tip: Leave the ESC code blank to let the system derive one from the text, or set it explicitly when you already know the correct classification. See ESC Codes & Symbology.
Inspecting an event
Click any event — on the map or in the Events tab — to open the Event Inspector: the event's details, its source material, attached media, and its place in the wider picture.
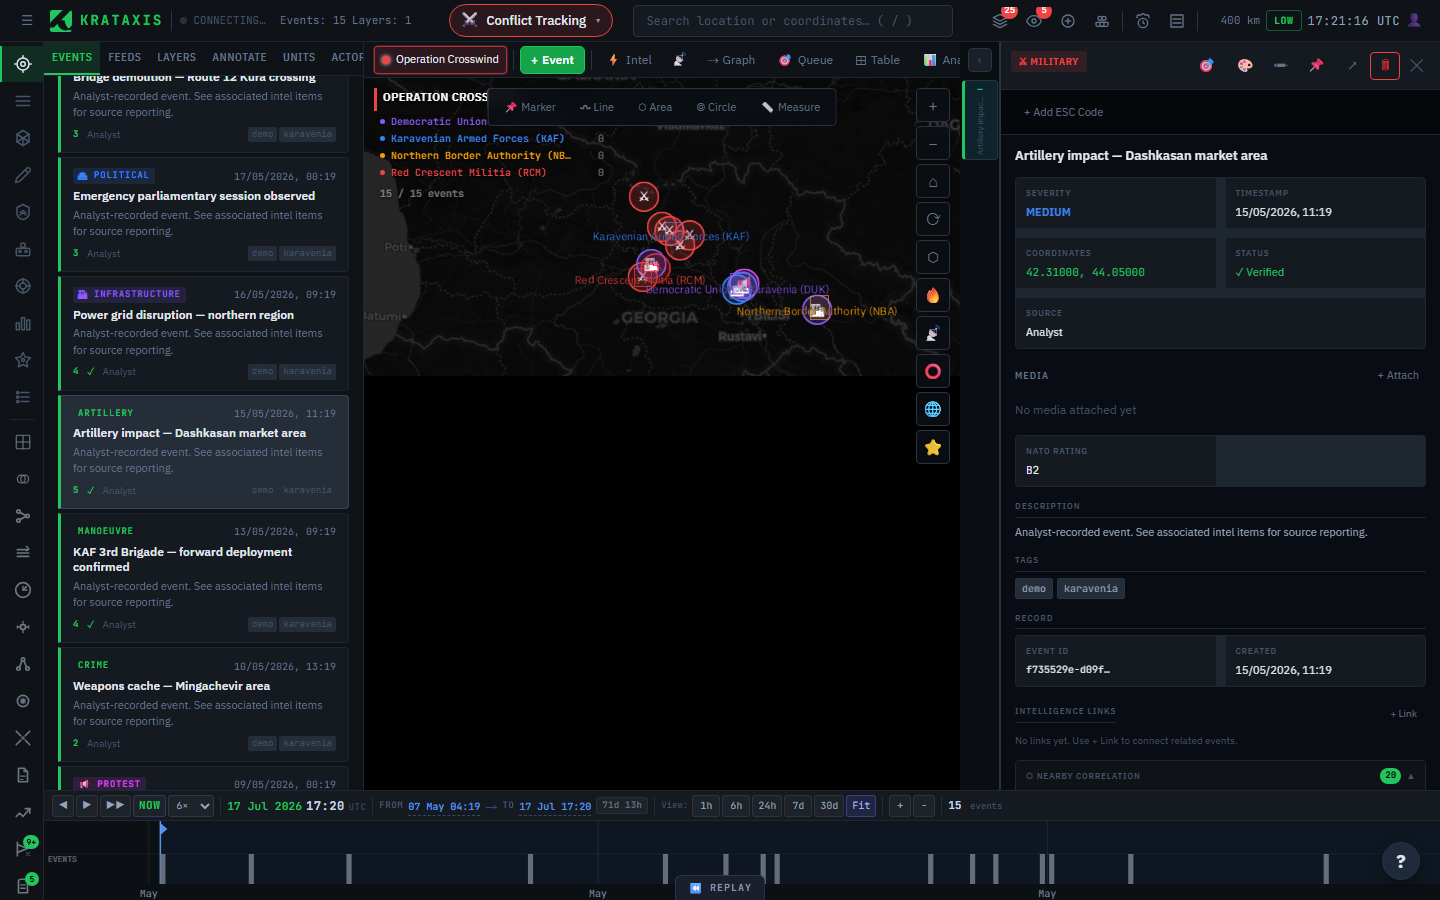
From the inspector you can:
- Read the full narrative, category, severity, and ESC code.
- Follow the source link back to the original report.
- See attached media (imagery rehosted by the platform so it stays available even if the original disappears).
- Check nearby correlation — other activity close in space and time, which is often where the story is.
- Jump into deeper analysis — for example, Explore in Workbench opens the Analytics Workbench scoped to a window around the event date.
The inspector is also where you judge an event: its credibility tier tells you whether you're looking at a single report or a heavily corroborated cluster — always check before you build on it. Think of the inspector as the event's dossier: everything known, everything attached, and every reason to believe or doubt it, on one page.
Linking events into chains
Events rarely stand alone — a manoeuvre precedes a clash; a strike follows a sighting. Krataxis lets you model these relationships so cause and effect become visible:
- Event links connect related events directly, from the inspector's Intelligence Links section.
- These links, together with intel and actors, render in the Intel Causal Graph — a full-page view of the causal chains across a battlespace.
Linking is how you turn a scatter of incidents into a narrative you can defend. It's the difference between a box of photographs and an album with captions: the facts are the same, but only one of them tells a story. A good habit: whenever you confirm an event, ask "what did this follow from, and what might it lead to?" and link accordingly.
Filtering the picture
The Events tab lists events with filters so you can narrow to what matters — by category, severity, or time. Combined with a focused battlespace (which restricts the map to one situation), filtering keeps the picture legible when reporting is heavy.
If the map ever feels like a wall of markers, reach for the filters and a focused battlespace before anything else — clutter is almost always a scope problem, not a data problem.
Where to next
- Actors & Territory — who is behind the events.
- The Intel Causal Graph — see linked events as causal chains.